Difference between revisions of "Chart Displays"
From dataZoa Wiki
| (14 intermediate revisions by the same user not shown) | |||
| Line 1: | Line 1: | ||
| − | A Chart [[Displays|display]] shows data series or cross-sections graphically, for example: | + | <div class="imgGlyph24 imgConcept"></div> A Chart [[Displays|display]] shows data series or cross-sections graphically, for example: |
<table class="GTableTextPic"> | <table class="GTableTextPic"> | ||
| Line 12: | Line 12: | ||
<br> | <br> | ||
| − | + | {{Template:Display_Description_See_Also|editorPage=Chart_Display_Editor}} | |
| − | + | ||
| − | + | ||
| − | + | ||
| − | + | ||
| − | + | ||
| − | + | ||
<br> | <br> | ||
<br> | <br> | ||
==Chart Highlights== | ==Chart Highlights== | ||
| − | * Automatic updating, citations | + | * [[Automatic_Updates|Automatic updating]], [[Display_Editor_Footer_Tab#Automatic_Citations|Automatic citations]] |
| + | * Optional tools for [[Hardcopy#Data|exports]], [[Hardcopy#Displays|PDFs]] and [[Hardcopy#Displays|Printing]] | ||
* Full control over colors, labels, and formatting | * Full control over colors, labels, and formatting | ||
| − | * Responsive design | + | * [[Display_Editor_Responsive_Design_Tab|Responsive design]] |
| + | |||
| + | [[Category:Getting_Started]][[Category:Examples]] | ||
| + | [[Category:Definitions]] | ||
| + | [[Category:How_To]] | ||
Latest revision as of 13:22, 27 February 2017
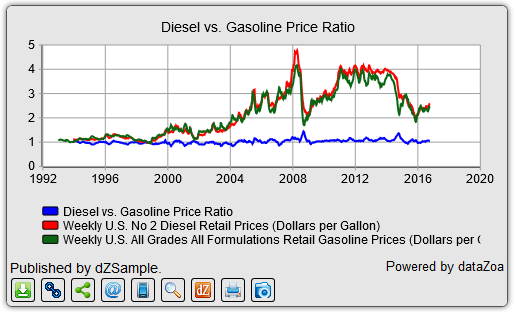
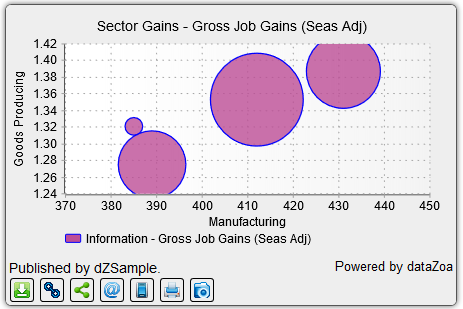
A Chart display shows data series or cross-sections graphically, for example:| One-click-simple: | |
| or more sophisticated: |
See also:
Create
Edit
Copy
Circulate
Publish
Chart Highlights
- Automatic updating, Automatic citations
- Optional tools for exports, PDFs and Printing
- Full control over colors, labels, and formatting
- Responsive design


