Difference between revisions of "Table Displays"
From dataZoa Wiki
| Line 1: | Line 1: | ||
| + | |||
| + | <div class="imgGlyph24 imgConcept"></div> <b><i>Display a table with a bit of history?</i></b> Easy. Pick the data, push a button. | ||
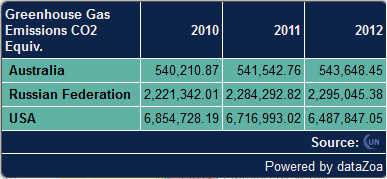
A table [[Displays|display]] shows data series as rows, with dates as columns, for example: | A table [[Displays|display]] shows data series as rows, with dates as columns, for example: | ||
| Line 10: | Line 12: | ||
==Table Highlights== | ==Table Highlights== | ||
| − | * | + | * [[Automatic_Updates|Data stays current]] |
| − | * | + | * Built-in pop charts |
| + | * [[Display_Editor_Footer_Tab#Automatic_Citations|Sources cited automatically]] | ||
* One-click [[Label_Knockouts|label cleanups]] | * One-click [[Label_Knockouts|label cleanups]] | ||
| − | * | + | * Built-in period-over-period calculations |
| − | * | + | * Options for [[Exporting_Data|exports]], [[Hardcopy|PDFs]] and [[Hardcopy|Printing]] |
* Full control over colors, labels, and formatting | * Full control over colors, labels, and formatting | ||
* [[Display_Editor_Responsive_Design_Tab|Responsive design]] | * [[Display_Editor_Responsive_Design_Tab|Responsive design]] | ||
Latest revision as of 12:08, 27 April 2017
Display a table with a bit of history? Easy. Pick the data, push a button.A table display shows data series as rows, with dates as columns, for example:
See also:
Create
Edit
Copy
Circulate
Publish
Table Highlights
- Data stays current
- Built-in pop charts
- Sources cited automatically
- One-click label cleanups
- Built-in period-over-period calculations
- Options for exports, PDFs and Printing
- Full control over colors, labels, and formatting
- Responsive design


