Difference between revisions of "LatestValues Displays"
From dataZoa Wiki
| Line 5: | Line 5: | ||
<br> | <br> | ||
| − | See how to:<b> | + | See how to:<b>{{Template:Display_Editor_See_Also}} |
| + | <br> | ||
| + | |||
[[Displays#Creating|Create]] | [[Displays#Creating|Create]] | ||
[[LatestValues_Display_Editor|Edit]] | [[LatestValues_Display_Editor|Edit]] | ||
Revision as of 14:27, 22 February 2017
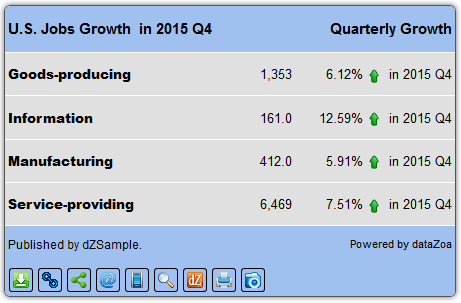
A Latest Values display shows a cross section (typically the latest period) of data series as rows,
with calculations and comparisons as columns, for example:
See how to:See also:<b>
Create
Copy
Circulate
Publish
for Displays
Create
Edit
Copy
Circulate
Publish
</b>
LatestValues Highlights
- Click through quick charts
- Automatic period-over-period calculations
- One-click label cleanups
- Automatic updating, citations
- Optional tools for exports, PDFs and Printing
- Full control over colors, labels, and formatting
- Responsive design


