Difference between revisions of "Chart Displays"
From dataZoa Wiki
| Line 30: | Line 30: | ||
[[Category:Getting_Started]][[Category:Examples]] | [[Category:Getting_Started]][[Category:Examples]] | ||
[[Category:Definitions]] | [[Category:Definitions]] | ||
| + | [[Category:How_To]] | ||
Revision as of 13:43, 21 February 2017
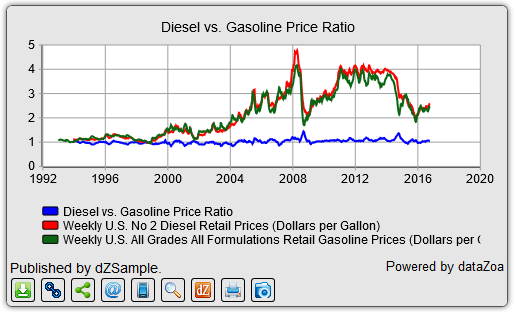
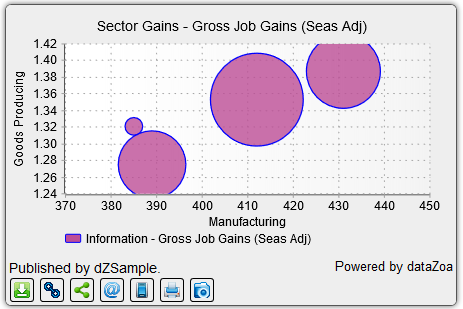
A Chart display shows data series or cross-sections graphically, for example:| One-click-simple: | |
| or more sophisticated: |
See how to:
Create
Edit
Copy
Circulate
Publish
Chart Highlights
- Automatic updating, citations
- Optional tools for exports, PDFs and Printing
- Full control over colors, labels, and formatting
- Responsive design


