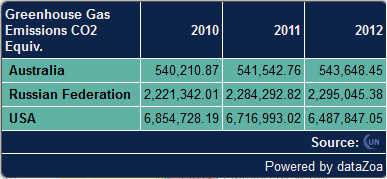
Chart Displays
From dataZoa Wiki
Revision as of 07:41, 12 January 2017 by SNC (Talk | contribs) (Created page with " A Chart display shows data series or cross-sections graphically, for example: A Table Display <br> See how to:<b> &...")
A Chart display shows data series or cross-sections graphically, for example:
See how to:
Create
Edit
Copy
Circulate
Publish
Chart Highlights
- Click through charts
- Automatic period-over-period calculations
- One-click label cleanups
- Automatic updating, citations, exports
- Full control over colors, labels, and formatting
- Responsive design


