Difference between revisions of "Chart Displays"
From dataZoa Wiki
| Line 4: | Line 4: | ||
<table class="GTableTextPic"> | <table class="GTableTextPic"> | ||
<tr> | <tr> | ||
| − | <td> | + | <td>Sohisticated:</td><td><div class="imgSnippetWrap1"><div class="Gdib">[[File:LineChartExample.PNG|none|Line Chart Example]]</div></div></td> |
</tr> | </tr> | ||
<tr> | <tr> | ||
| − | <td>Or | + | <td>Or one-click-simple:</td><td><div class="imgSnippetWrap1"><div class="Gdib">[[File:LineChartExample.PNG|none|Line Chart Example]]</div></div></td> |
</tr> | </tr> | ||
</table> | </table> | ||
Revision as of 07:46, 12 January 2017
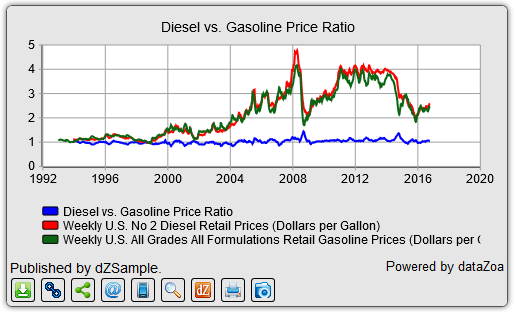
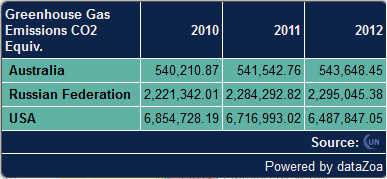
A Chart display shows data series or cross-sections graphically, for example:
| Sohisticated: | |
| Or one-click-simple: |
See how to:
Create
Edit
Copy
Circulate
Publish
Chart Highlights
- Click through charts
- Automatic period-over-period calculations
- One-click label cleanups
- Automatic updating, citations, exports
- Full control over colors, labels, and formatting
- Responsive design


