Difference between revisions of "Workbench Data Rows"
From dataZoa Wiki
| Line 2: | Line 2: | ||
<table class="GTableTextPic Gbb1" > | <table class="GTableTextPic Gbb1" > | ||
| + | <tr> | ||
| + | <td> | ||
| + | A typical series... | ||
| + | </td><td> | ||
| + | <div class="imgSnippetWrap1 "><div class="imgSnippet " title="Single Series in the Workbench" data-styler="{ view: '126', style: ' width: 500px; height: 34px; background: url(SQ/img/DocSamples/snap12.pngSQ) scroll -43px -214px; background-repeat: no-repeat; ' }"></div></div> | ||
| + | |||
| + | </tr><tr> | ||
<tr> | <tr> | ||
<td> | <td> | ||
Latest revision as of 12:38, 3 February 2017
Every row in the Workbench is packed with information about the data series it represents.
|
A typical series... |
|
|
This is a Weekly series, from the US EIA, acquired in October, 2016, and is marked open to the world and shareable. |
|
| The series contributes to a formula. |
|
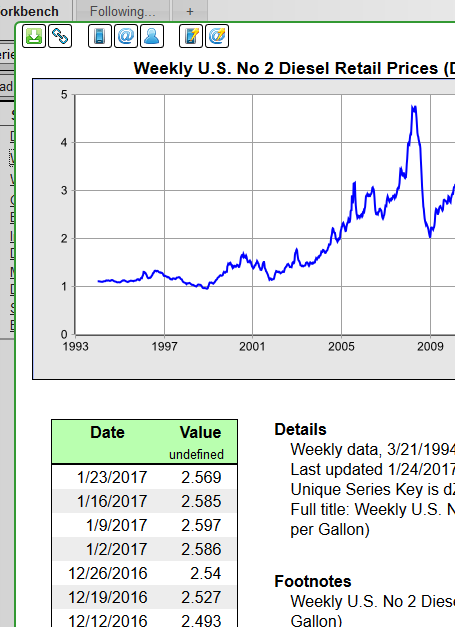
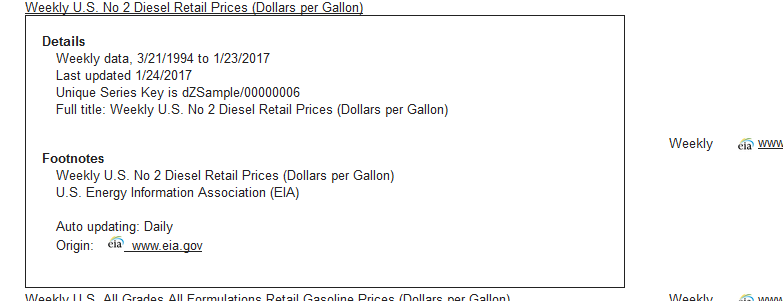
| Click on the title for a picture and background information. | |
|
Hover on the row, see the information button and expand the row to see even more about the series. |


