Difference between revisions of "Table Displays"
From dataZoa Wiki
| Line 4: | Line 4: | ||
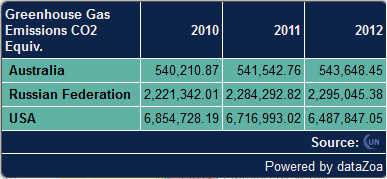
[[File:TableDisplayExample.PNG|none|A Table Display]] | [[File:TableDisplayExample.PNG|none|A Table Display]] | ||
| − | See how to: | + | See how to:<b> |
| − | [[Displays#Creating|Create]][[Displays#Editing|Edit]] | + | [[Displays#Creating|Create]] |
| + | [[Displays#Editing|Edit]] | ||
[[Displays#Copying|Copy]] | [[Displays#Copying|Copy]] | ||
[[Displays#Circulate|Circulate]] | [[Displays#Circulate|Circulate]] | ||
[[Displays#Publish|Publish]] | [[Displays#Publish|Publish]] | ||
| + | </b> | ||
==Table Highlights== | ==Table Highlights== | ||
Revision as of 12:07, 10 January 2017
A table display shows data series as rows, with dates as columns, for example:
See how to: Create Edit Copy Circulate Publish


